Designing Immune Receptors
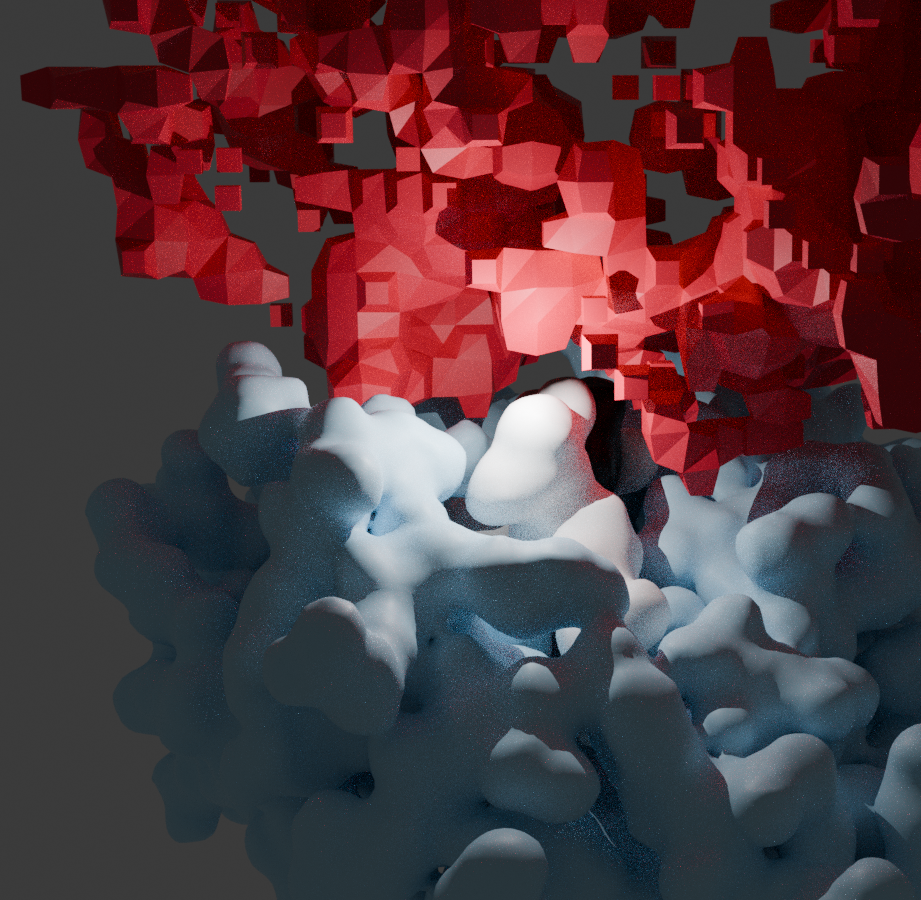
The surfaces of white blood cells are covered in receptors that act as three-dimensional puzzle pieces that only match proteins that are not native to the body.
Blender PDB Files Geometry Nodes
Signals of cancer can appear on the surface of tumour cells
Healthy cells present fragments of their proteins, called peptides, on their surface. These peptides are held in place by molecules called MHC. When a cell acquires a mutation that causes it to behave like a tumour cell, there is a chance that the mutation in question gets presented by the MHC. When this happens, white blood cells have an opportunity to recognise the mutated peptide with the receptors on its surface.
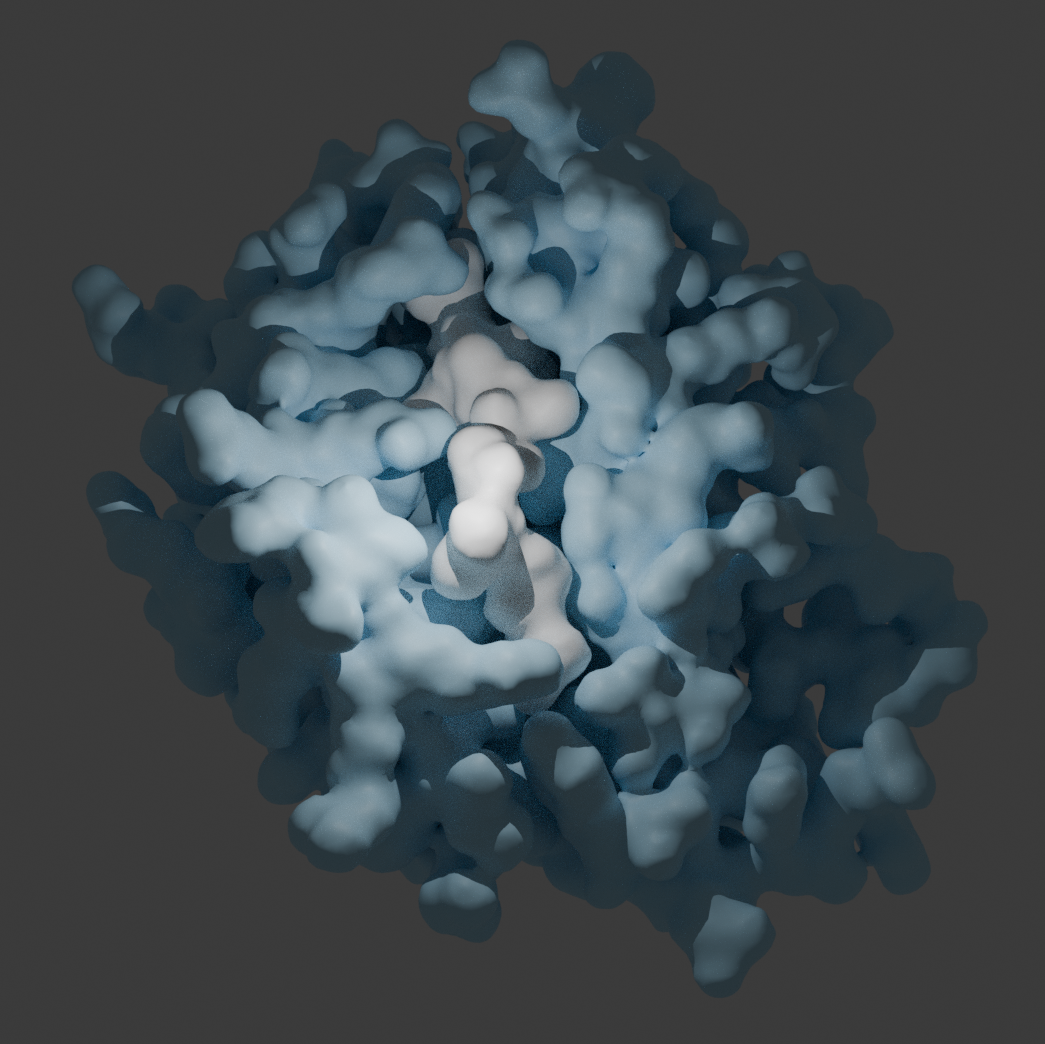
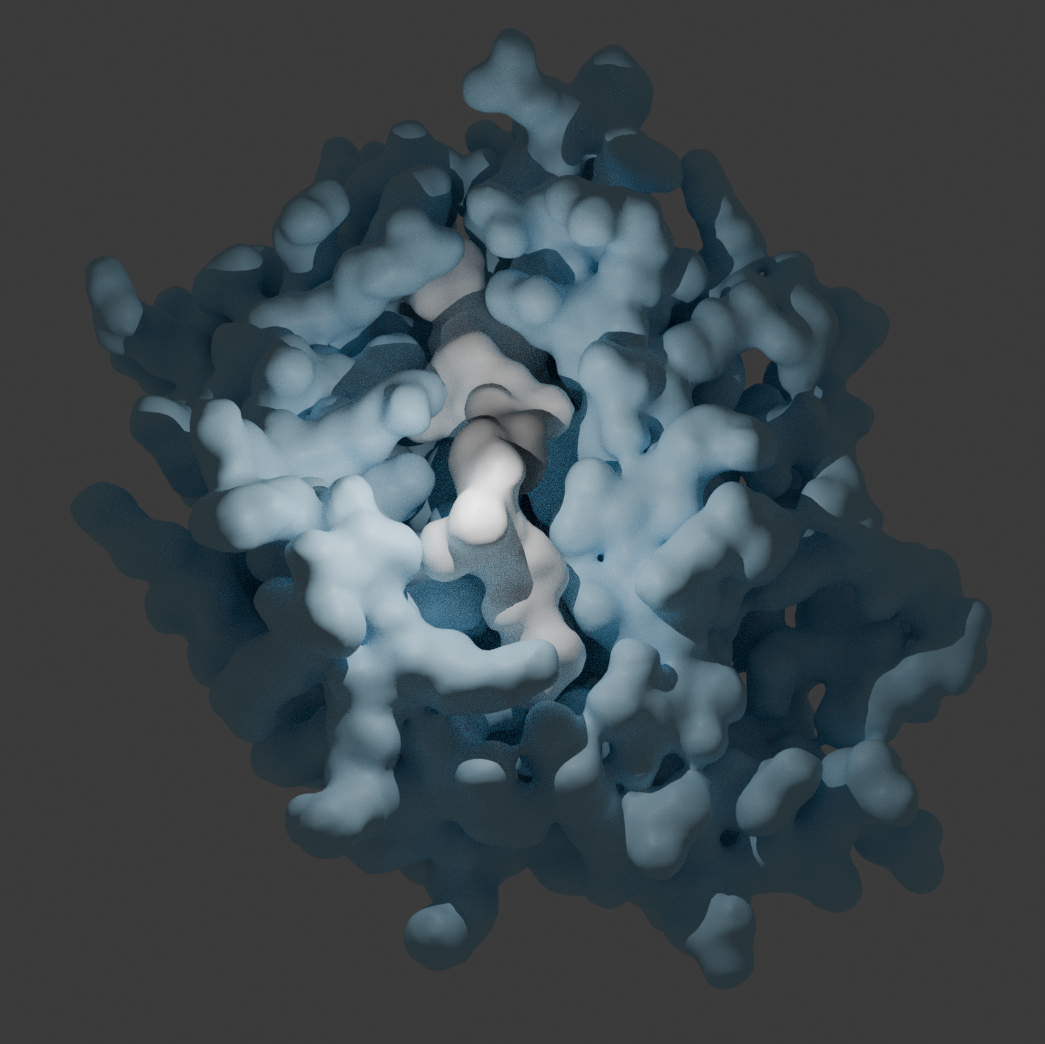
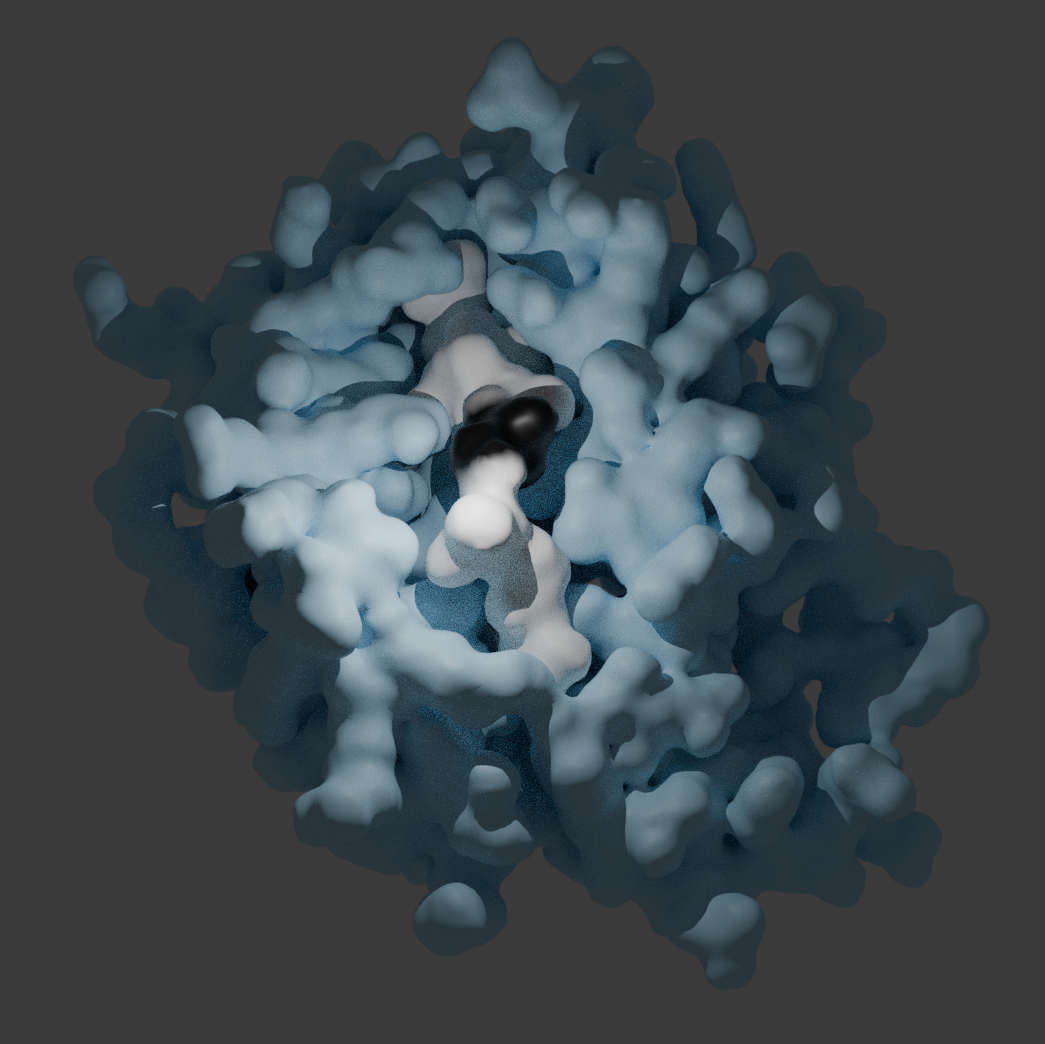
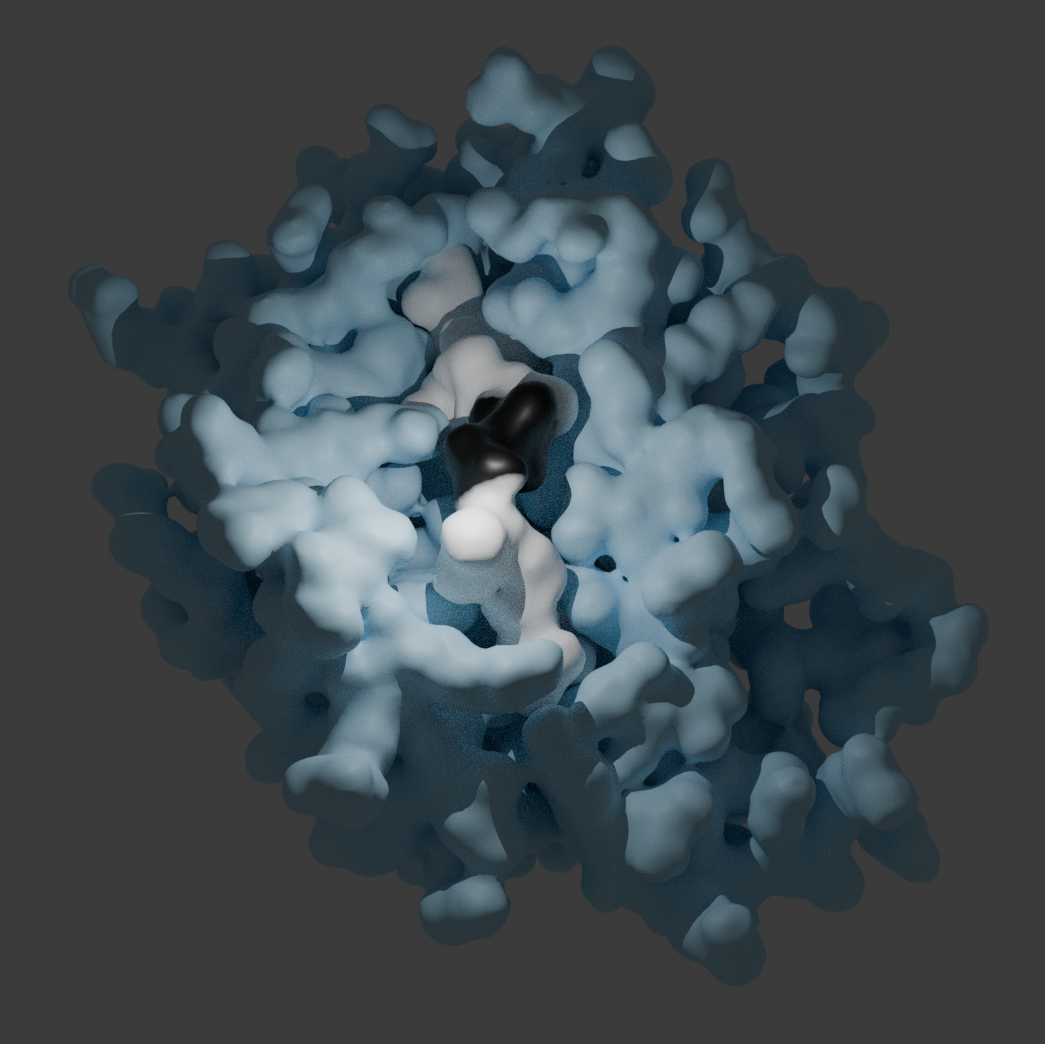
Designing receptors that match the cancer signal, but not healthy cells, is hard
Finding white blood cell receptors that bind to the mutated peptide and not the healthy variant is difficult because often there is only one amino acid difference between healthy and cancerous. If cells bind the healthy variant there is a risk that they will attack healthy cells, generating an auto-immune response.
This is where AI can be used to navigate the search space of the white blood cell receptor sequences (L. Cornwall, G. Szep et al. 2023). By training models to predict which amino acids best the surface of the MHC, we can restrict the search space for amino acid sequences in the loop regions of the receptor that are responsible for recognising diseased cells.
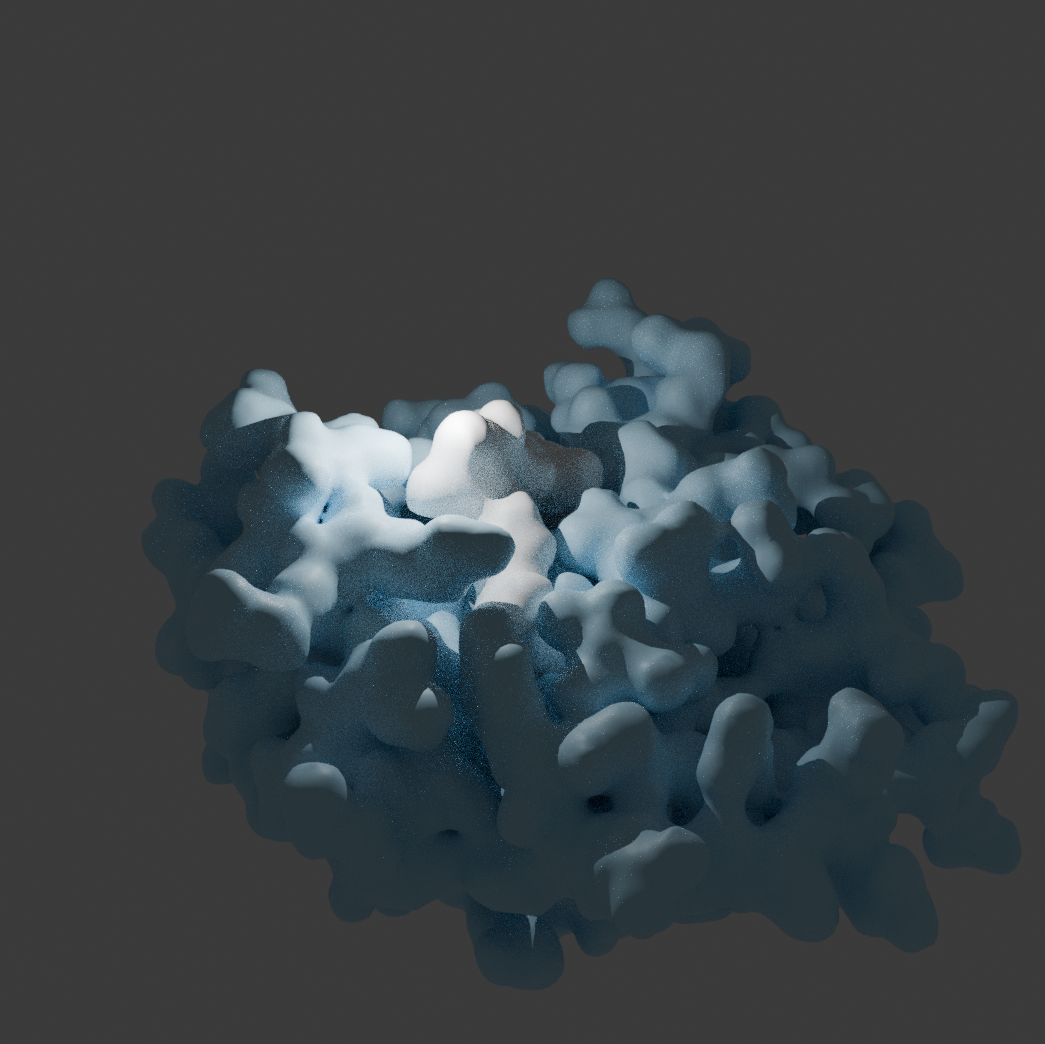
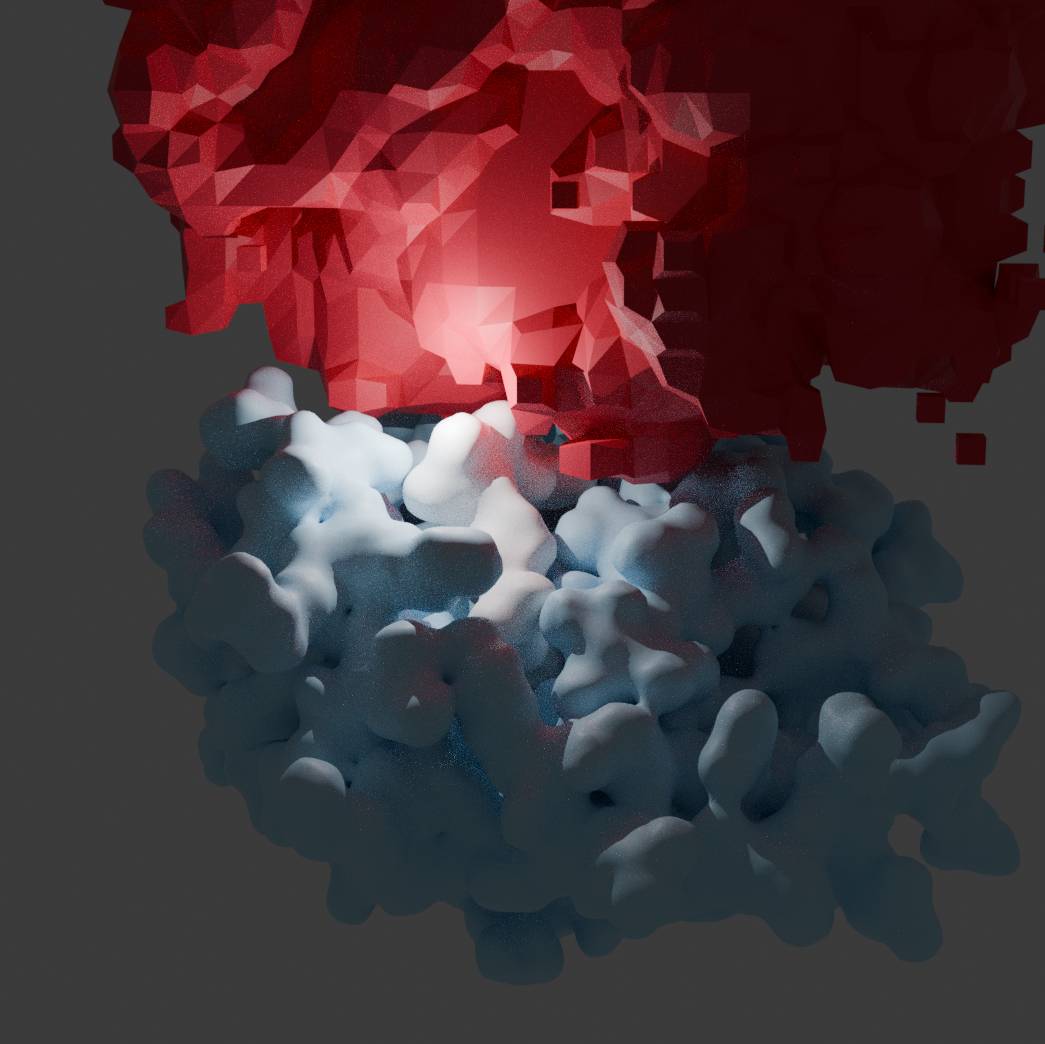
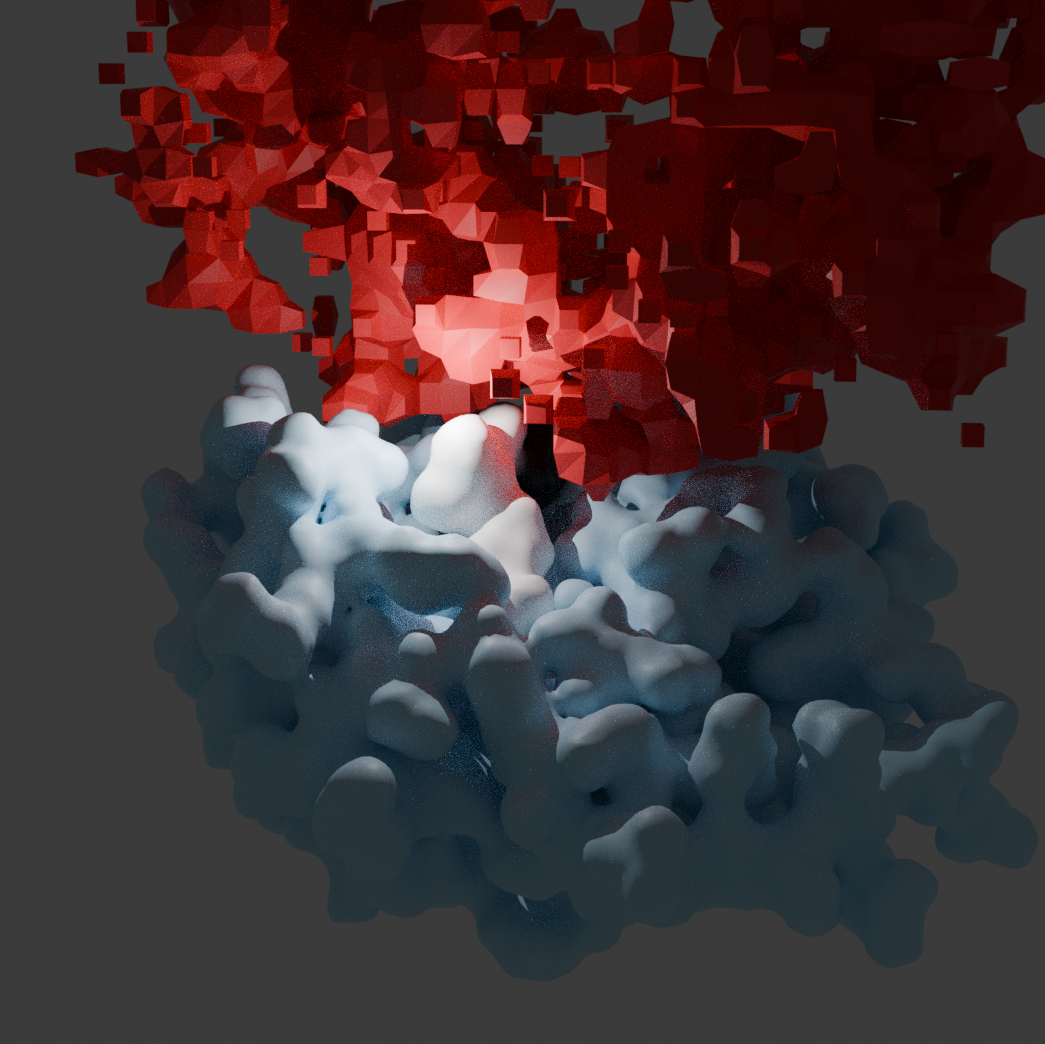
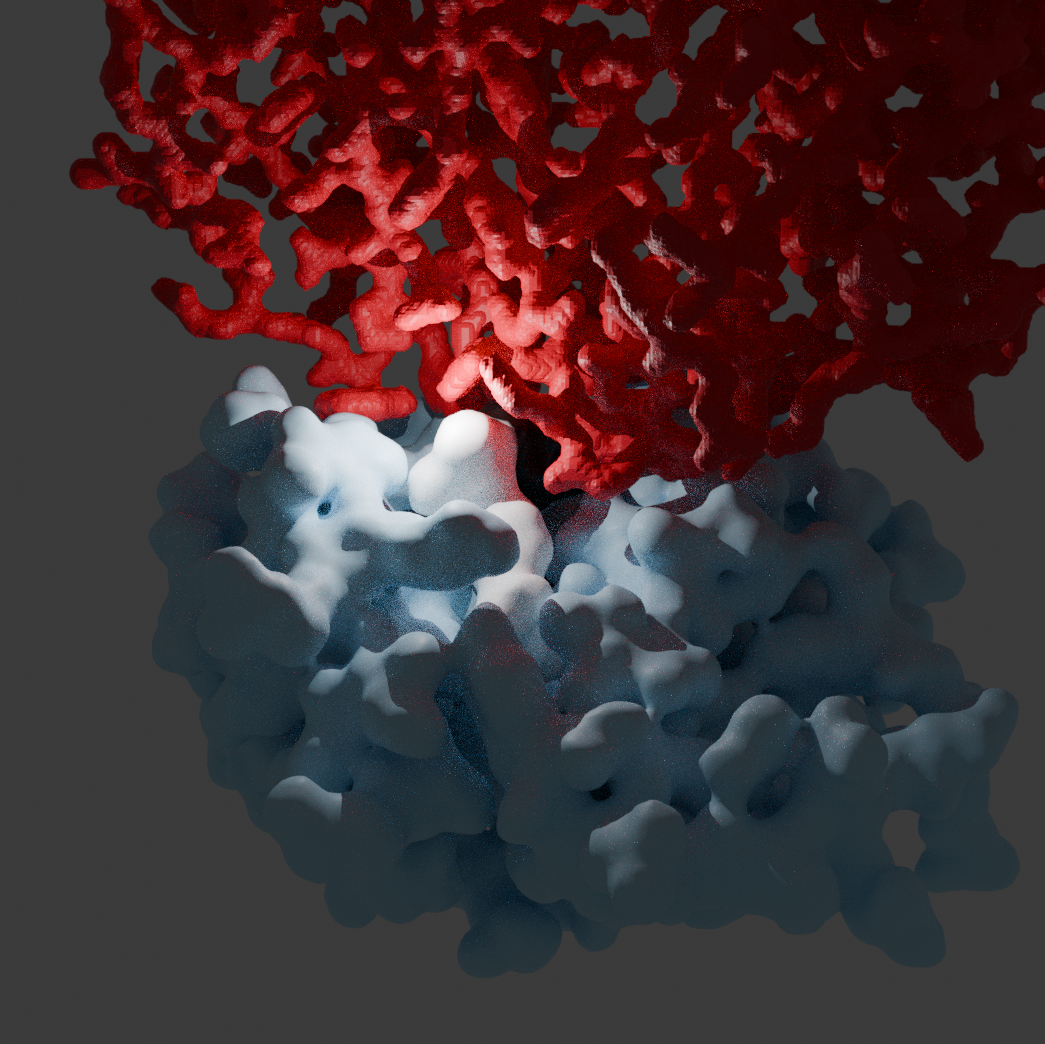
Using Blender to Visualise the Combinatoric Complexity
The generative model produces PDB Files that look like this
ATOM      1  N   GLY A   1     -17.507  12.508  39.735  1.00 56.47           N
ATOM      2  CA  GLY A   1     -16.155  12.561  40.353  1.00 60.73           C
ATOM      3  C   GLY A   1     -15.103  12.063  39.385  1.00 59.90           C
ATOM      4  O   GLY A   1     -15.449  11.565  38.306  1.00 61.33           O
ATOM      5  N   SER A   2     -13.833  12.192  39.769  1.00 56.73           N
ATOM      6  CA  SER A   2     -12.706  11.742  38.953  1.00 51.69           C
ATOM      7  C   SER A   2     -12.824  10.268  38.580  1.00 48.65           C
ATOM      8  O   SER A   2     -13.552   9.508  39.225  1.00 47.19           O
ATOM      9  CB  SER A   2     -11.380  11.953  39.693  1.00 50.43           C
ATOM     10  OG  SER A   2     -11.145  13.320  39.967  1.00 55.79           O
ATOM     11  N   HIS A   3     -12.097   9.869  37.542  1.00 45.13           N
ATOM     12  CA  HIS A   3     -12.088   8.491  37.067  1.00 40.71           C
ATOM     13  C   HIS A   3     -10.750   8.214  36.417  1.00 39.80           C
ATOM     14  O   HIS A   3      -9.988   9.134  36.109  1.00 40.77           O
ATOM     15  CB  HIS A   3     -13.222   8.239  36.067  1.00 39.18           C
ATOM     16  CG  HIS A   3     -14.581   8.170  36.696  1.00 43.37           C
ATOM     17  ND1 HIS A   3     -14.891   7.290  37.714  1.00 37.60           N
ATOM     18  CD2 HIS A   3     -15.710   8.884  36.464  1.00 41.98           C
ATOM     19  CE1 HIS A   3     -16.149   7.464  38.080  1.00 36.06           C
ATOM     20  NE2 HIS A   3     -16.667   8.427  37.335  1.00 36.24           N
...
Each line contains the coordinates of an atom, which species it is, and which chain and amino acid it belongs to. It is possible to import these files into Blender using the amazing Molecular Nodes add-on. This add-on allows you to use Geometry Nodes to render desired properties using any of the information available in the PDB file.
References
L. Cornwall, G. Szep et al. 2023. NeurIPS Generative AI & Biology Workshop. Fine-tuned protein language models capture T cell receptor stochasticity
B.A. Johnston. 2024. MolecularNodes. zenodo.org/records/11483365