Exploring High-dimensional Point Clouds

An app to explore high-dimensional point clouds.
OpenLayers D3.js
What is Flow Cytometry and why is it high-dimensional?
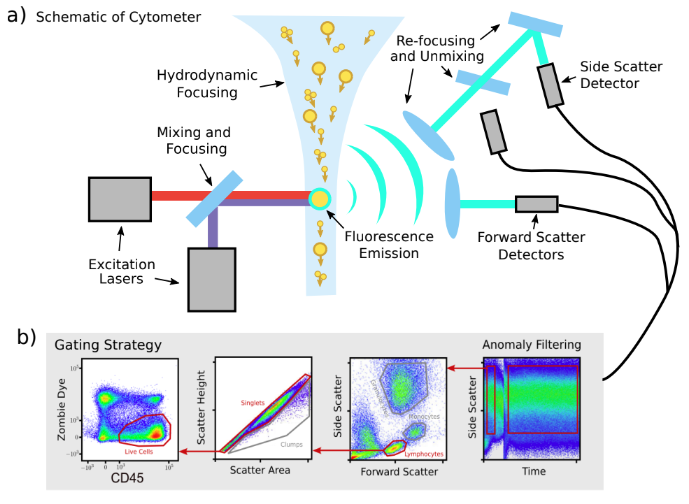
Flow Cytometry is a powerful technique for identifying different cell types within a biological sample, which may contain hundreds of millions of cells. Below is a simplified schematic, revealing how cells become high-dimensional points.

Using OpenLayers to navigate gigascale point clouds
Instead of exploring the high-dimensional data via two-dimensional projections, dimensionality reduction methods, such a self-organised maps (M. Kratochvil et al. 2020), can learn a two-dimensional manifold embedded in the high-dimensional space of the point cloud, that minimises the projection distances to all points.
These two dimensional embeddings are very popular figures in publications involving single-cell datasets as they offer a global qualitative overview of the different cell types and their relationships. When datasets approach hundreds of millions of points, unfortunately these figures become too crowded, attempting to show too much information at once.
This is where OpenLayers comes to the rescue. Instead of rendering the whole dataset at a fixed resolution, the embedded dataset is tiled and organised as a quadtree at different resolutions. The extent of the view box and desired zoom level is then used to render tiles as and when needed. The same algorithm is used to allow users to navigate satellite image data of the whole planet, without needing to load hundreds of GBs of data into memory.
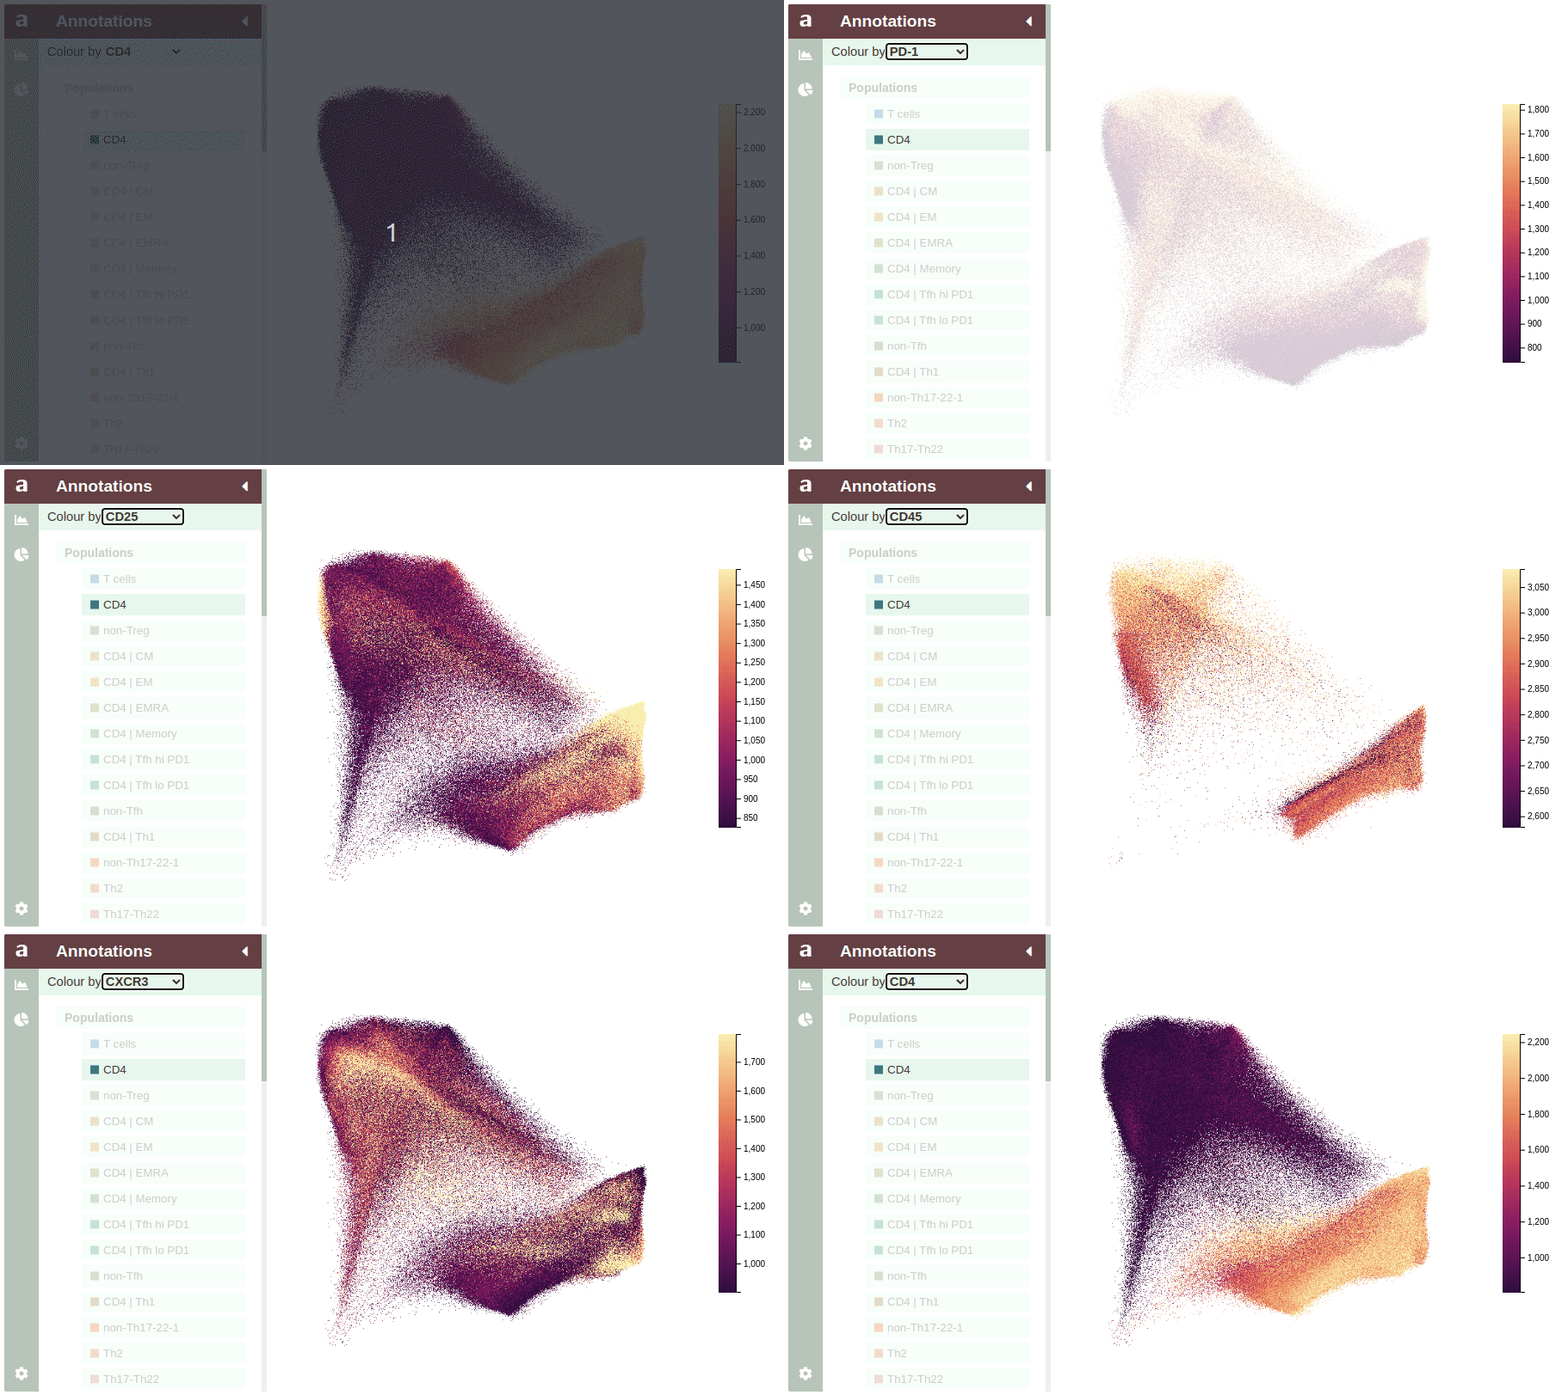
We can then add all sorts of interactive features to this data visualisation, that would otherwise exist as static panels in a figure, using D3.js. In the figure below, we can identify what different clusters in the embedding represent by colouring each point by the fluorescence measurement that was taken for that cell.

This, and other data exploration features are available in FlowAtlas.jl.
References
V. Coppard, G. Szep et al. 2023. FlowAtlas. jl: an interactive tool bridging FlowJo with computational tools in Julia. bioRxiv, 2023.12. 21.572741
MetaCarta and Dev Team. OpenLayers, 2006.